process
Model Inputs
To arrive at our model results for the four scenarios, we used three main sets of data inputs: maps of land use change, climate projections, and crop management practices.
Land Use and Land Cover Inputs
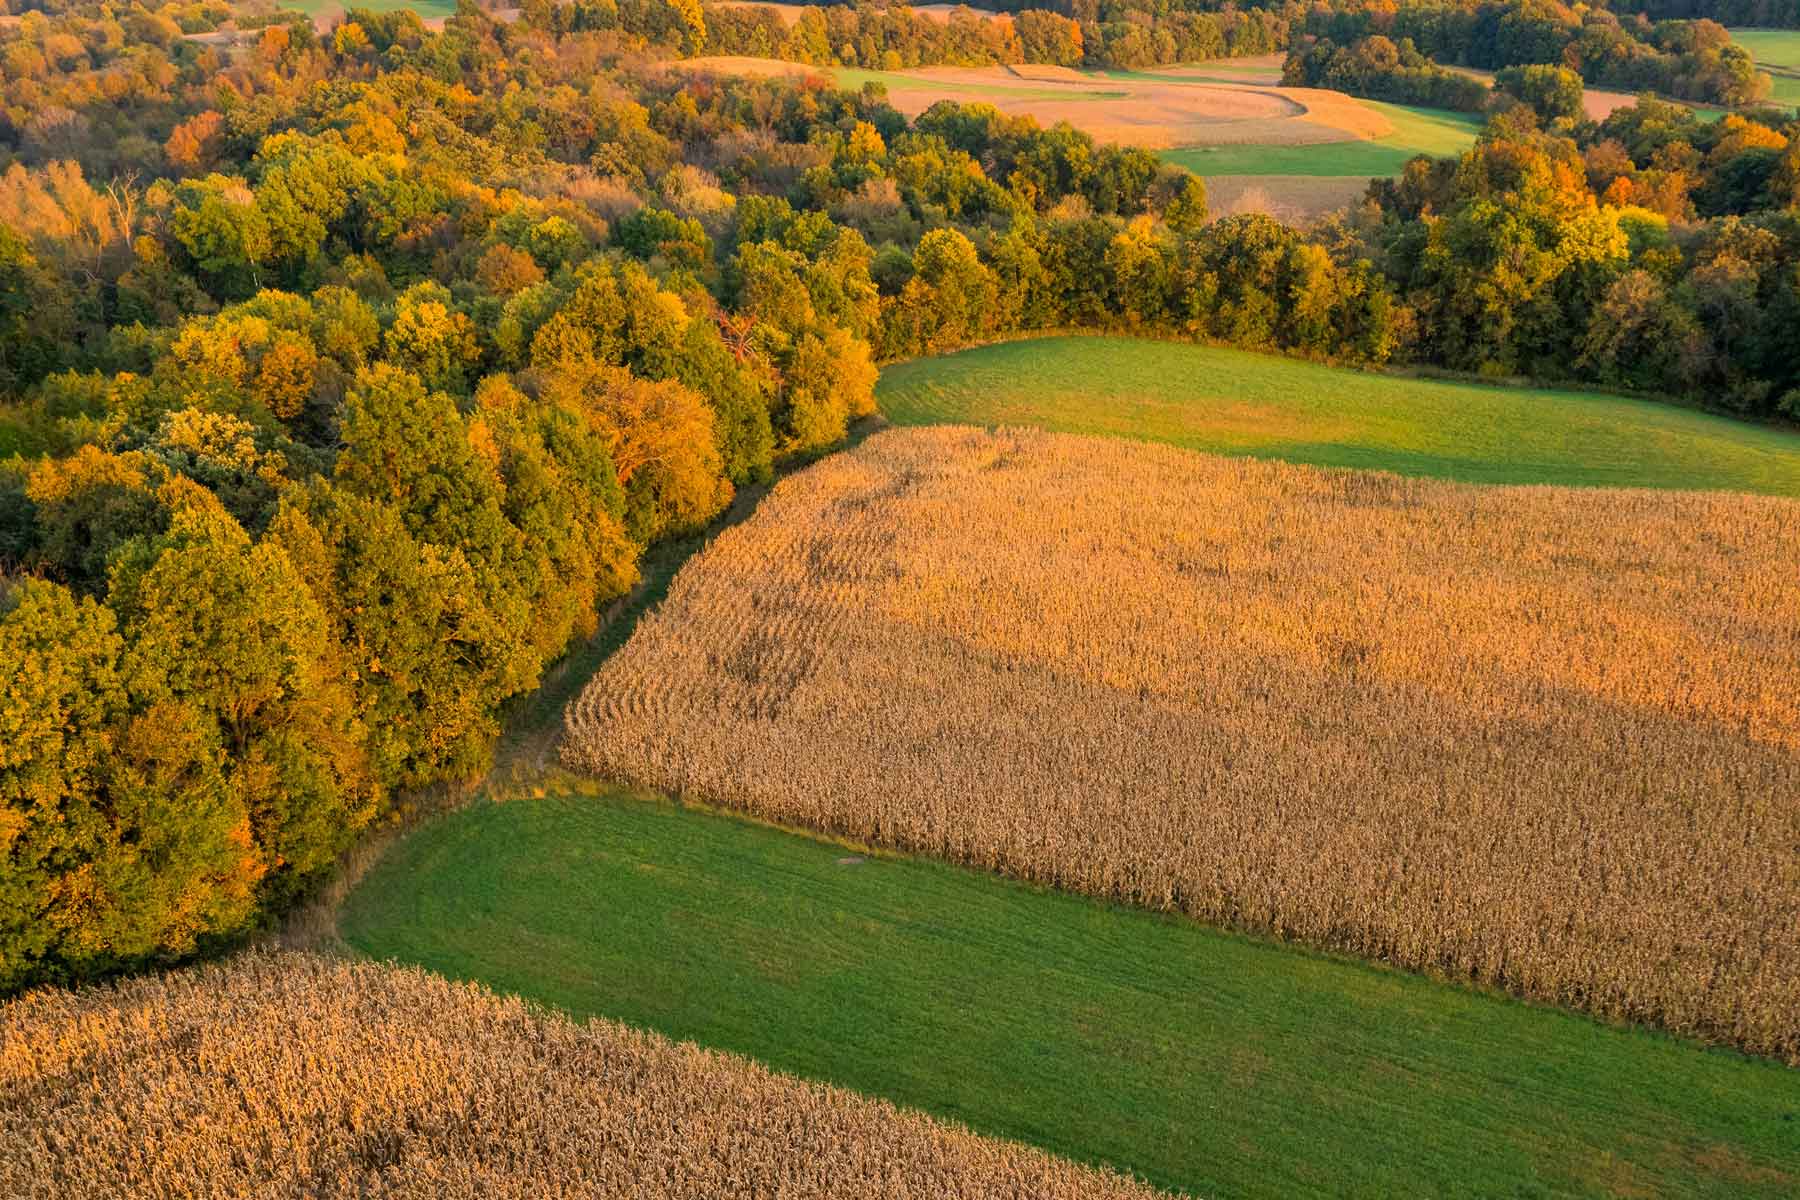
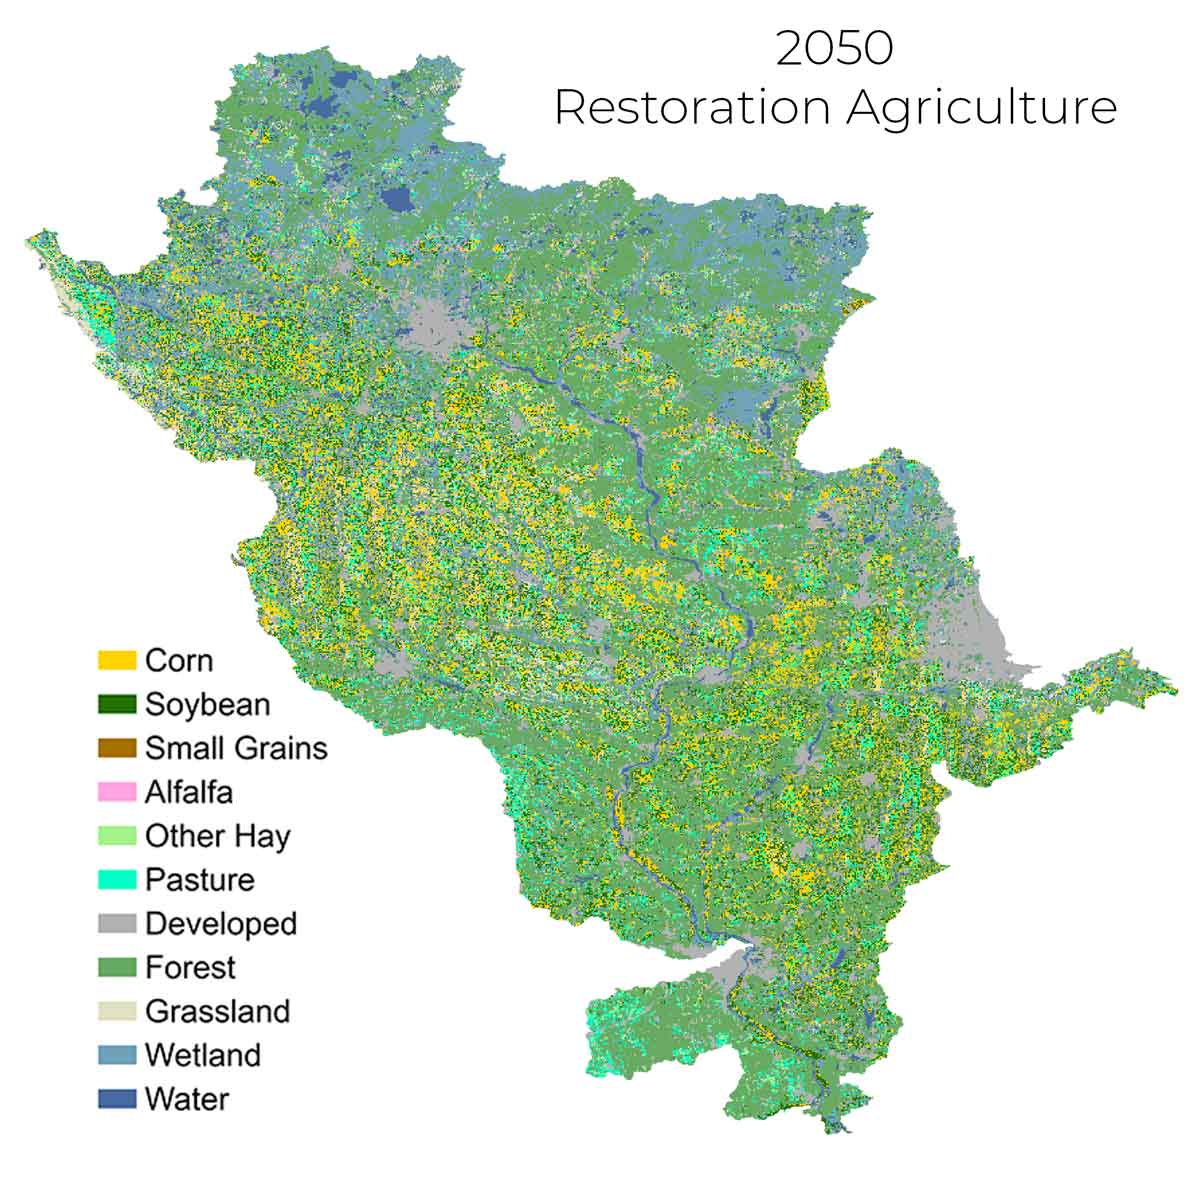
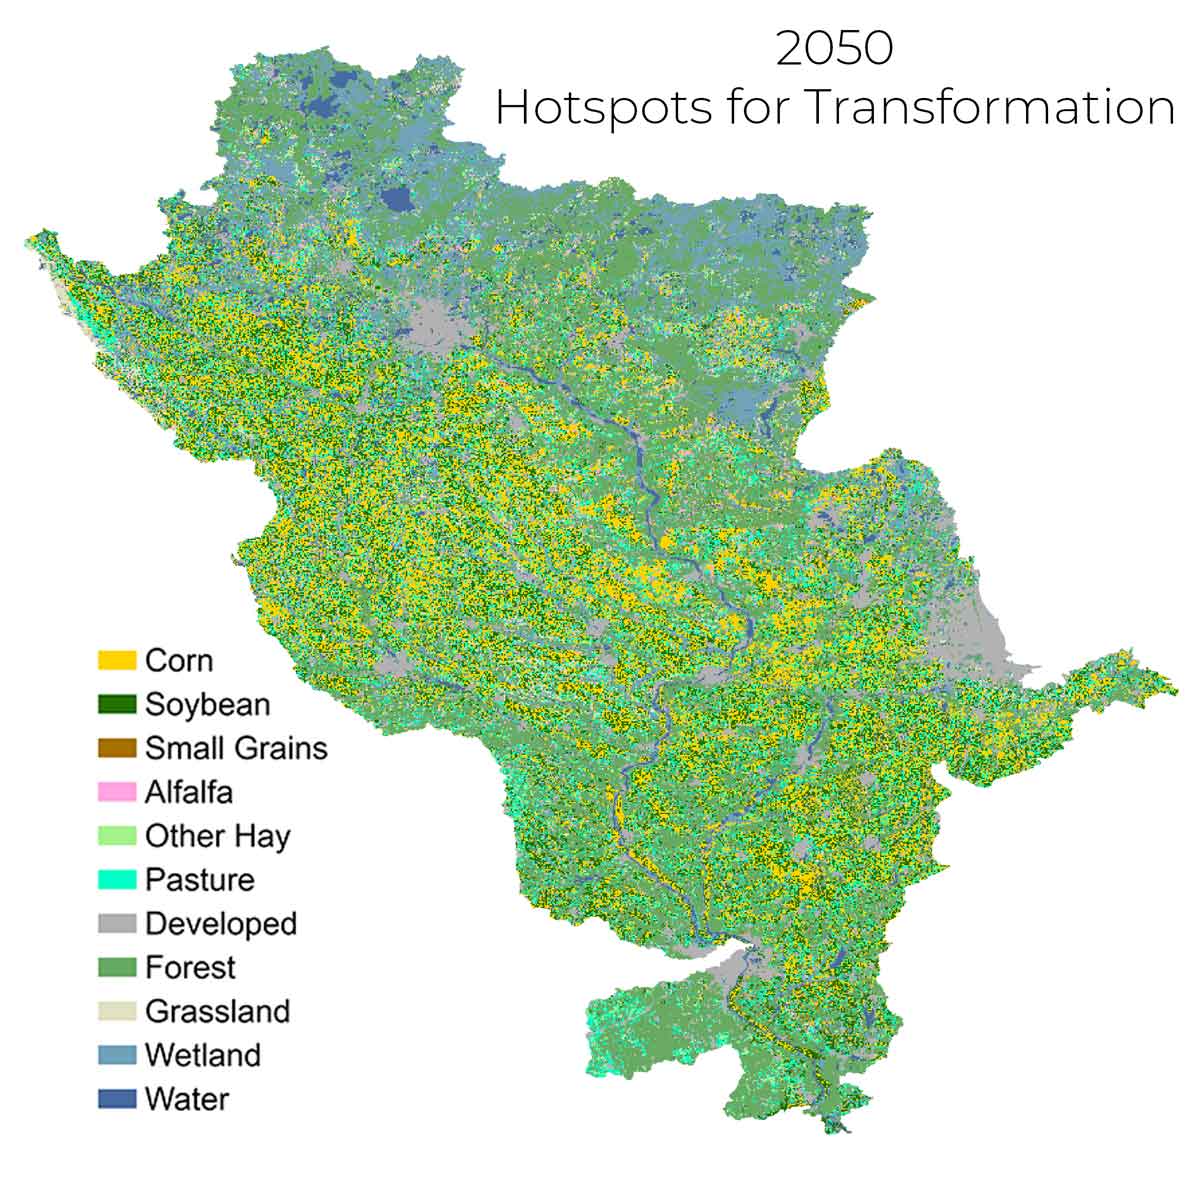
Mapped land use in the Upper Mississippi River Basin formed the backbone of each modeled scenario. To project the impact of each imagined future, our models needed to know what was happening on the landscape and where.
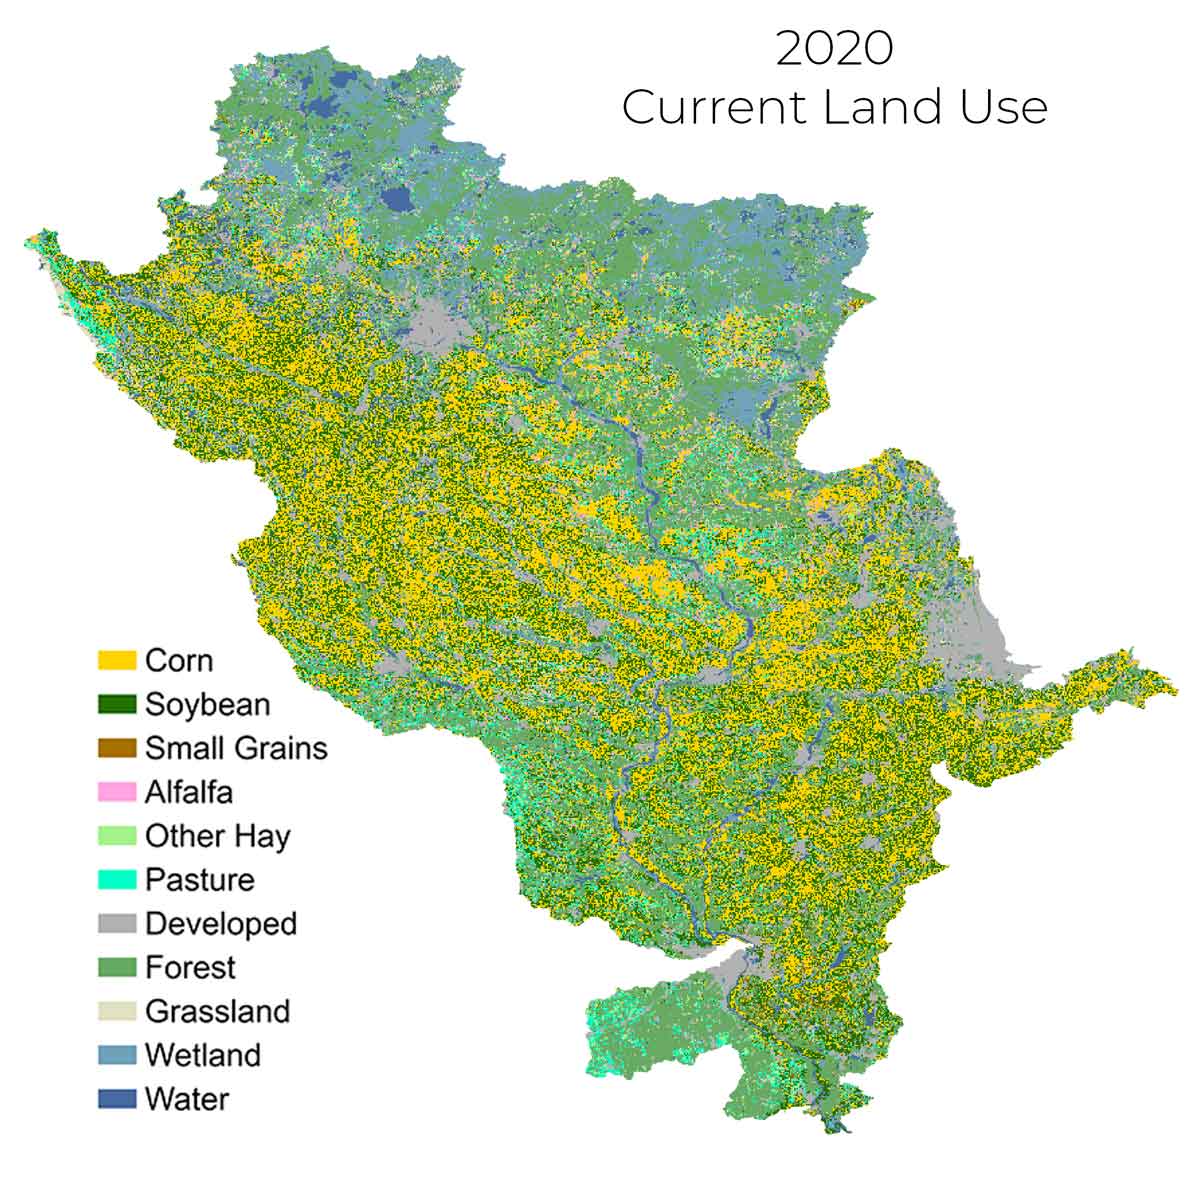
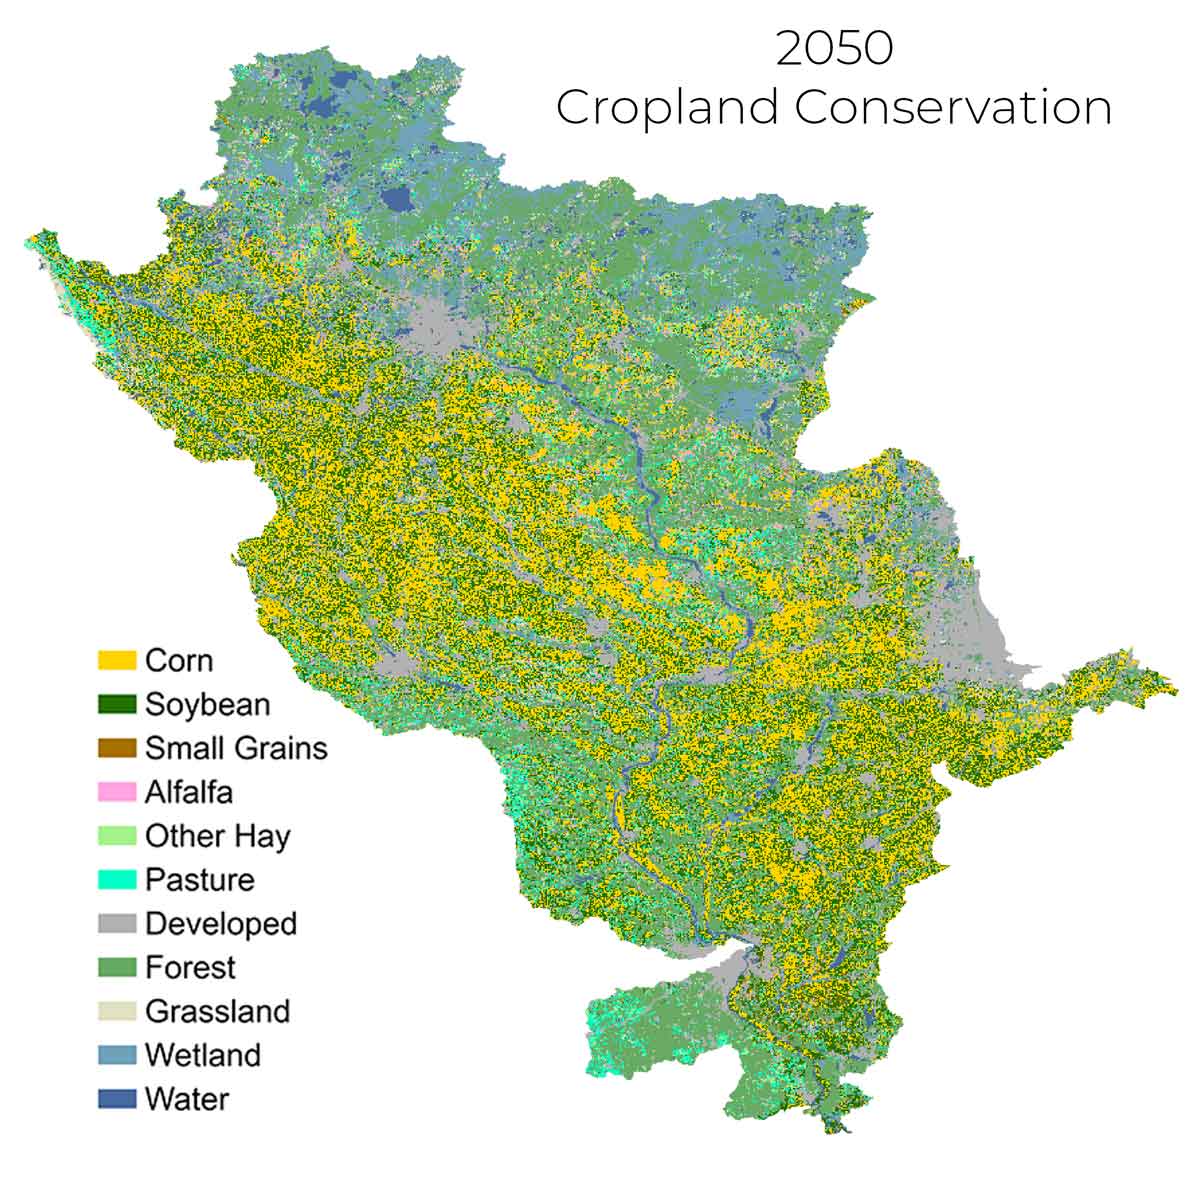
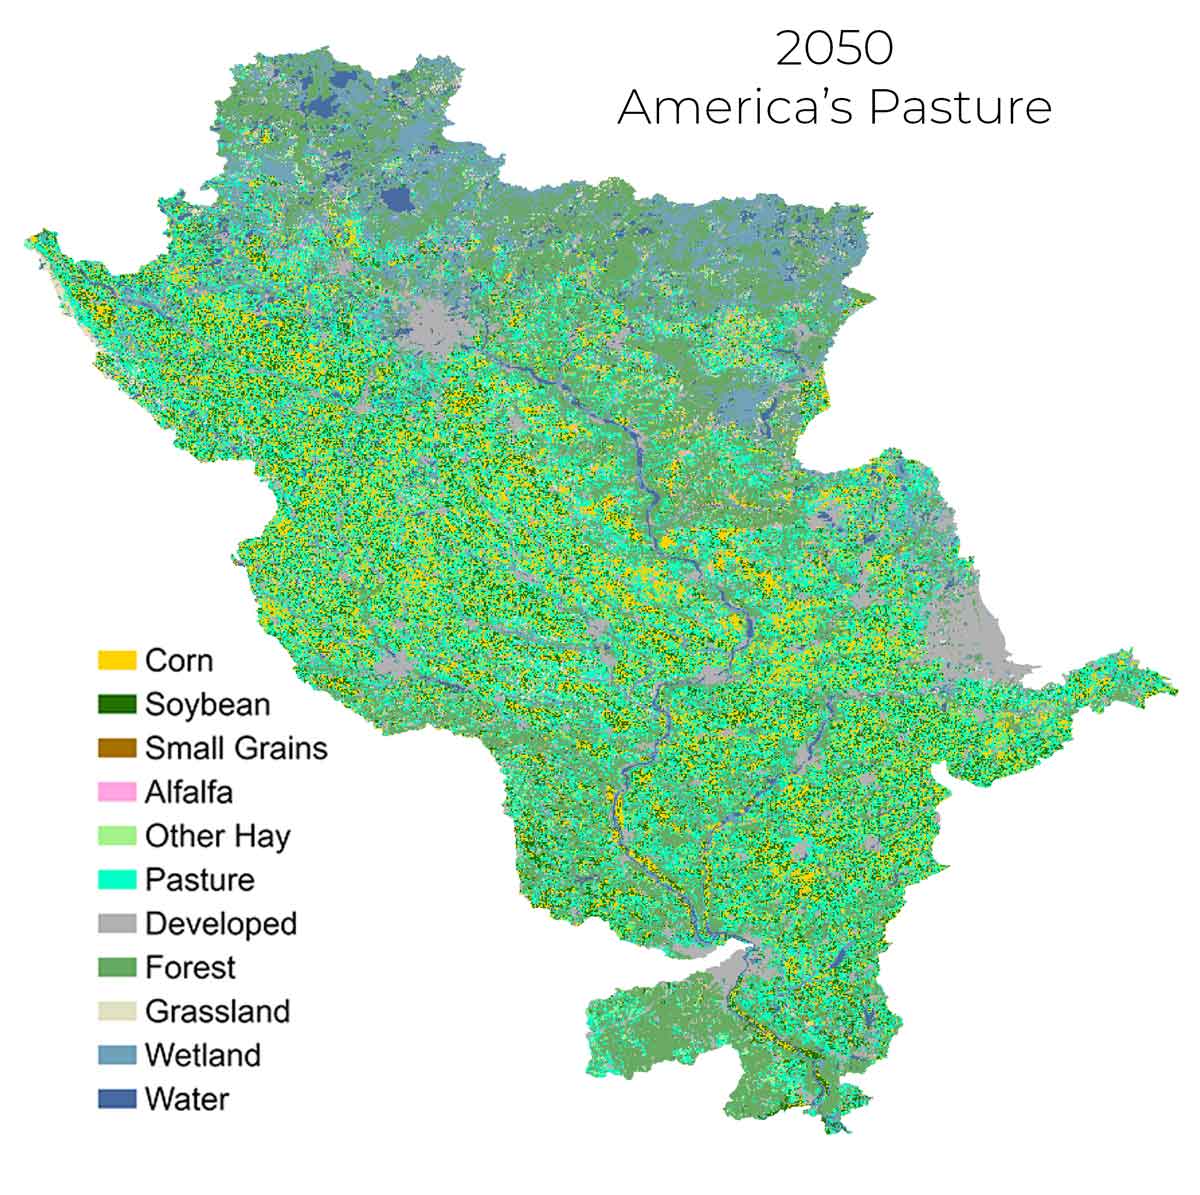
For each scenario, we produced two maps of the Basin, one reflecting current land use (as of 2020), and one representing the 2050 scenario. Each map is made up of square-kilometer “grid cells,” the resolution at which our models operate.
We then projected a gradual process of landscape change from each scenario’s initial map to its final one, starting from the year 2026 and unfolding over the course of the intervening decades.
Hover over each scenario’s button below to see how the region’s landscape evolves from today.
Climate Inputs
Our models relied on detailed weather and climate data. Due to global climate change, there wouldn’t be much value in making projections for 2050 based on today’s weather.
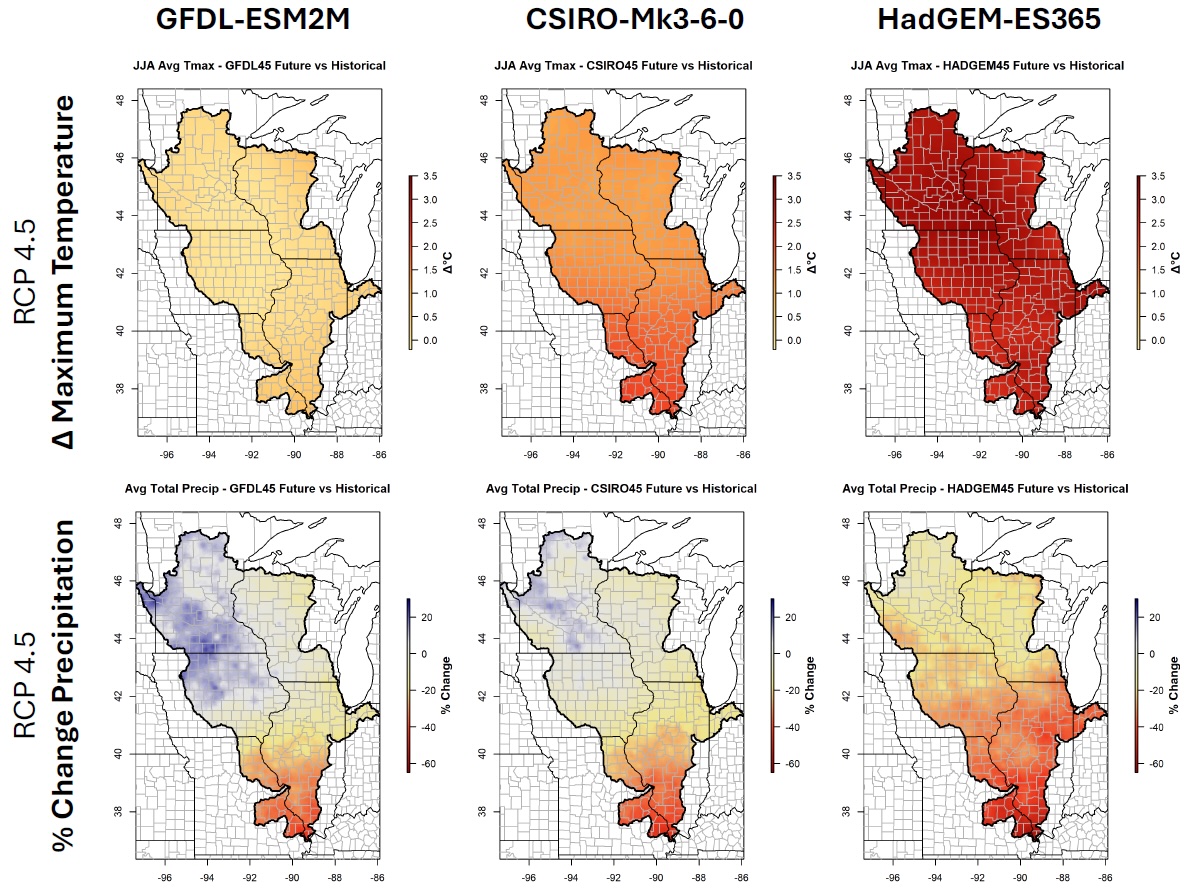
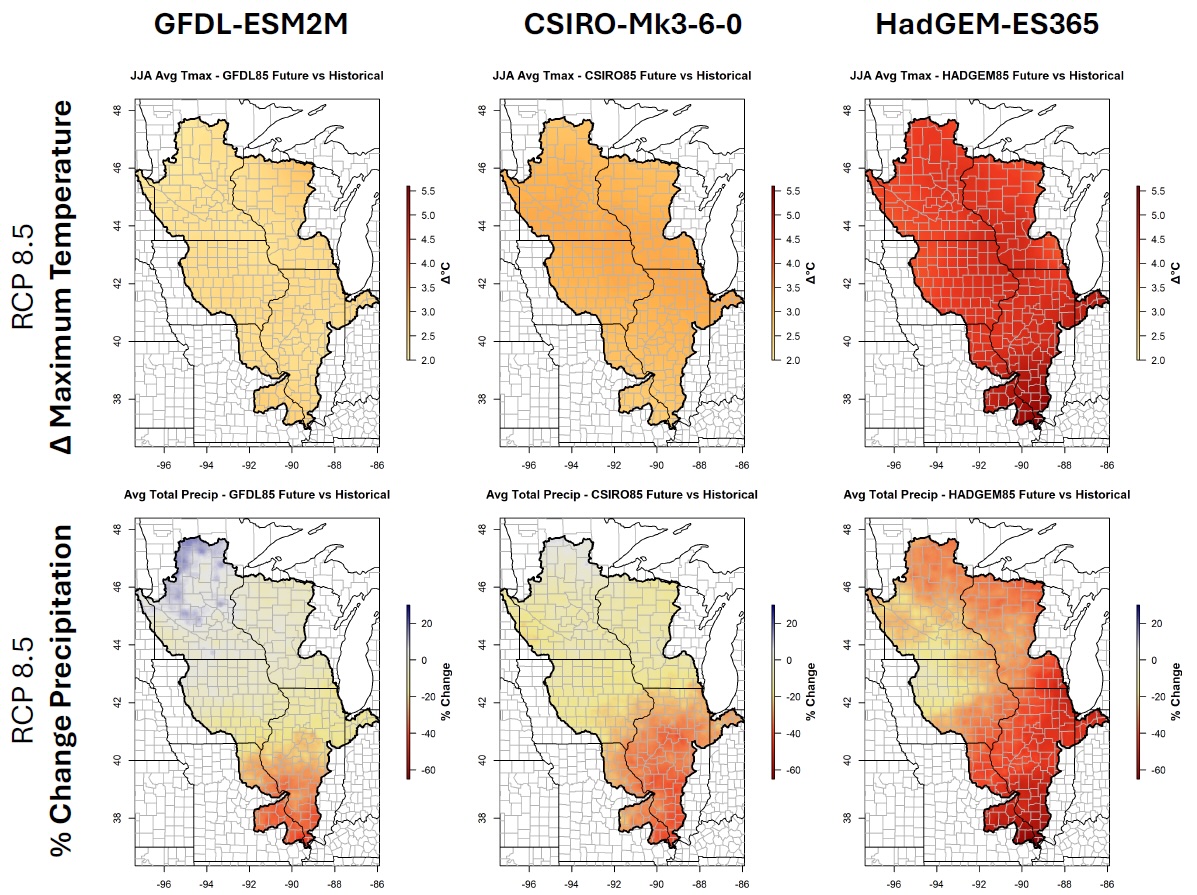
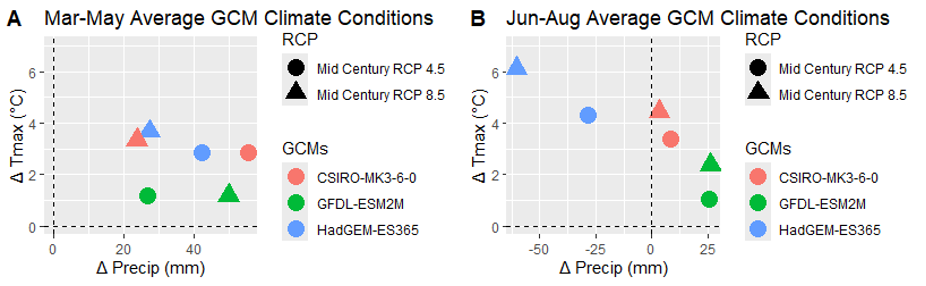
We modeled each scenario under six different projected future climates, combining three different precipitation projections and two greenhouse gas concentration pathways. We used existing downscaled global projections provided by the Multivariate Adaptive Constructive Analogs (MACA), which we then further downscaled statistically to the Upper Mississippi River basin.
Our goal was to represent the range of possible future climates and account for the uncertainty inherent in climate modeling. However, to simplify how we communicate our results, we included only two of the following six model-plus-emissions pathways across this website: the wettest and least warm (GFDL 4.5) and driest and hottest (HadGEM 8.5).
Precipitation Projections
We chose three models from the Coupled Model Intercomparison Project, a compilation of top-tier climate models from around the world.
- HadGEM2-ES365 – projects dry and hot conditions for the Basin
- GFDL-ESM2M – projects wetter and less hot conditions for the Basin
- CSIRO-Mk3-6-0 – projects conditions that are somewhere in between HadGEM and GFDL
We chose these three to capture the breadth of variation among high-quality models. Together, they represent a wide range of plausible climate futures that policymakers and decisionmakers might reasonably expect and prepare for.
Greenhouse Gas Concentration Pathways
Each climate model relies on future greenhouse gas concentrations developed by the Intergovernmental Panel on Climate Change (IPCC) to generate its projections. How much greenhouse gases there are in the atmosphere depends on humanity’s social, economic, and policy choices both now and in the future.
Representative Concentration Pathways, or “RCPs,” provide different future trajectories of greenhouse gas concentrations. We included two in our scenarios:
- RCP 4.5 is considered a “middle-of-the-road” pathway that is, arguably, close to our current, real-world trajectory. Cuts in carbon emissions are not aggressive enough to meet targets such as the Paris Climate Agreement’s goal of limiting warming to 1.5 degrees Celsius.
- RCP 8.5 is a high-carbon pathway, representing continued growth in emissions and relatively little effort to control them. It’s often used to represent “pessimistic” climate change trajectories.
Cropland Management Inputs
Our models also need to know how farmers manage croplands into the future to project future crop yield, nutrient runoff, and other results.
We modeled different percent changes for cover crop adoption, edge-of-field treatments (specifically saturated buffers on suitable tile-drained cropland land), fertilizer application rates, and confined livestock populations as a proxy for manure production. The percent increases or decreases correspond with the dietary, policy, and other social changes that happen in each scenario. Those differences are shown in the chart below.
Long Description of the Cropland Management Bar Chart
This chart presents a grouped vertical bar chart comparing four scenarios across four agricultural performance categories. The y-axis displays percent values ranging from 0% to 80%, with a bold, black baseline marking 0%. Each category on the x-axis contains four bars, one for each scenario: Cropland Conservation, America's Pasture, Restoration Agriculture, and Hotspots for Transformation.
Categories Displayed on the X-Axis
- Percent of cropland in cover crops
- Percent of suitable tile-drained cropland treated by saturated buffers
- Percent decrease in fertilizer application rates
- Percent decrease in confined livestock populations
Data Values by Scenario
Percent of cropland in cover crops
- Cropland Conservation: 75%
- America's Pasture: 75%
- Restoration Agriculture: 25%
- Hotspots for Transformation: 0%
Percent of suitable tile-drained cropland treated by saturated buffers
- Cropland Conservation: 50%
- America's Pasture: 25%
- Restoration Agriculture: 20%
- Hotspots for Transformation: 50%
Percent decrease in fertilizer application rates
- Cropland Conservation: 25%
- America's Pasture: 25%
- Restoration Agriculture: 10%
- Hotspots for Transformation: 50%
Percent decrease in confined livestock populations
- Cropland Conservation: 40%
- America's Pasture: 25%
- Restoration Agriculture: 25%
- Hotspots for Transformation: 10%