Model Results
Cropland Conservation Results
In 2050, almost all agriculture is conservation agriculture.
Scenario Snapshot
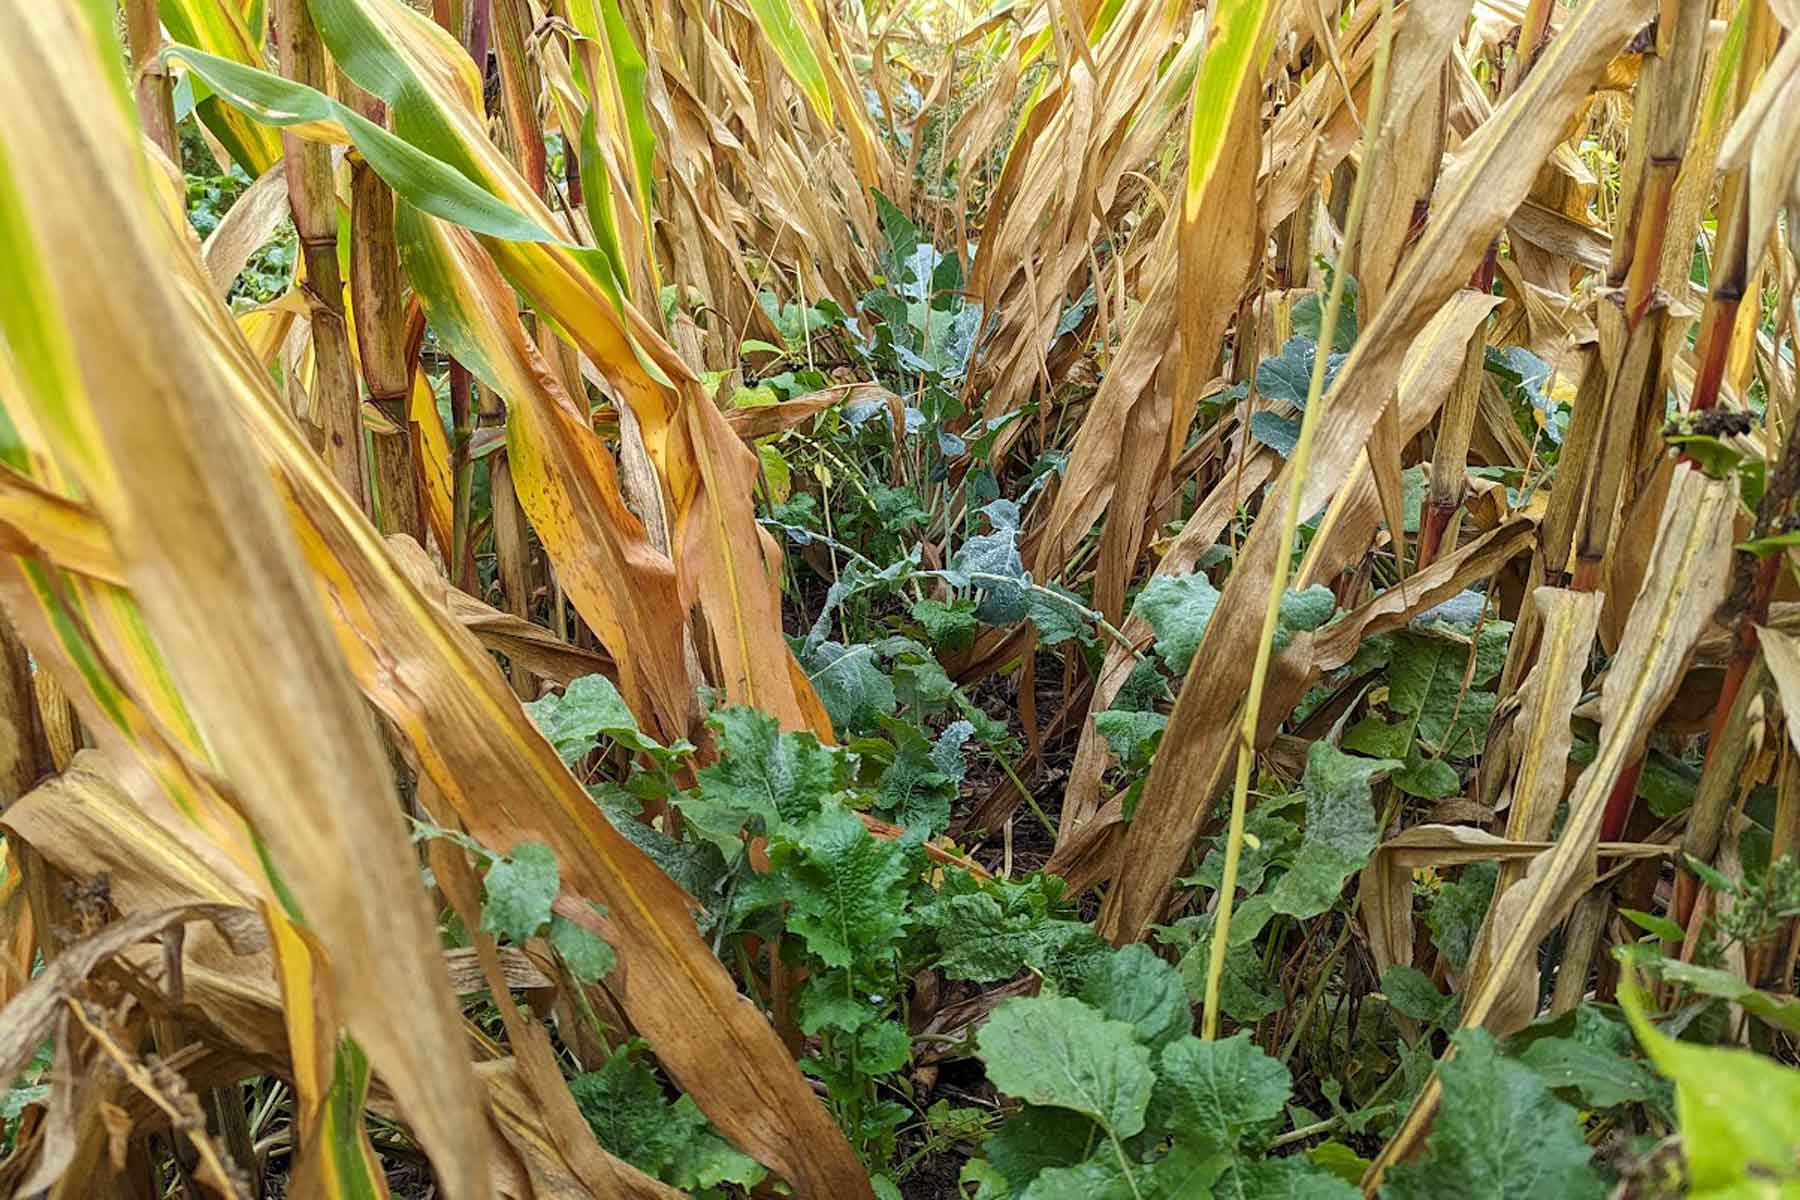
- Cover crops, no-till, and other conservation practices are each used on 75% of cropland. Edge-of-field treatments are used on 75% of suitable tile-drained cropland.
- Corn and soybeans have a land footprint nearly identical to 2025, and still supply meat, dairy, and crop exports.
- Fertilizer application rates have declined 25%.
- Due to the rise of electric cars, corn ethanol now primarily supplies aviation fuel.
Cropland Conservation Model Results
Toggle between the two climate projections – wet & warm and dry & hot – to see how climate conditions impact the outcomes. These climate projections represent the two ends of the range of six total projections we used in our models.
* 2002-2021 (Baseline 0) and 2051-2070 (Future)
Key Takeaways from Cropland Conservation
What do these model results mean? The following takeaways describe how this scenario’s model results compare to conditions today and to the model results of the other three scenarios. Unless specified, these takeaways hold for both the warm-and-wet and hot-and-dry climate projections.
2050 versus Today
Biofuels boom, with ecosystem benefits.
Under this scenario, biofuel production increases regardless of future climate conditions. The scenario assumes the biofuel industry primarily supplies aviation. At the same time, the region’s croplands and ecosystems store more carbon and hold more perennial biomass than today.
A mixed bag for water quality.
Nitrogen pollution improves, as high adoption of cover crops and saturated buffers reduces the amount of this nutrient reaching water bodies. On the other hand, phosphorus runoff worsens significantly. Even in dry climates, runoff from shoulder season precipitation drives phosphorus loss from this scenario’s still-abundant annual cropland and the ample legacy phosphorus in soils.
For food and water supply, climate plays a decisive role.
If the climate becomes warm and wet, food production ticks upward from present-day conditions, droughts become less common, and flooding becomes more frequent. Under hot and dry conditions, the inverse occurs—the region is marked by droughts and declining food crop yields.
Cropland Conservation versus The Other Three Scenarios
Food: Second-best for food production.
Because a large fraction of the landscape continues to feed vehicles instead of people, Cropland Conservation is behind grazing-focused America’s Pasture in food production. But the continued emphasis on row crop production generates enough food to reduce the impact of this tradeoff.
Biofuel: Best for biofuels.
For people who want to maintain biofuels as a key industry for the Basin, Cropland Conservation is likely the scenario of choice. It’s the only one that keeps a large share of land in biofuel-focused row crop production, and thus the only one without massive declines in biofuel output.
Water: Best for nitrogen, worst for phosphorus and sediment.
As a result of widespread conservation agricultural practices focused on nitrogen, Cropland Conservation reduces nitrogen pollution significantly more than the other three scenarios. But the practices are less effective against phosphorus and sediment loss, and by midcentury there will be more legacy phosphorus in soils and a more extreme climate. For those reasons, Cropland Conservation results in setbacks larger than any other scenario for those indicators.
Ecosystems: Nature lags slightly.
Ecosystem carbon increases at a magnitude roughly similar to the other scenarios, but perennial biomass is significantly lower—a consequence of keeping so much of the landscape in annual row crop production.